AI SVG Generator ROI: Calculate Cost per Accepted Asset
By Ashesh Dhakal, Founder, SVG AI
ai svg generatordesign roicost per assetsvg workflow
Compare the cost of accepted assets, including the work needed to make them usable. The number of generation attempts is a different measure: rejected variations consume time or credits without increasing the finished set.
Use the interactive cost worksheet to compare two workflows. Its starting values are deliberately hypothetical. They are not current plan prices, a customer result or a claim that AI will save a fixed percentage of your costs.
Define the same finished task for both workflows
Choose a small real project and write the acceptance requirements first: subjects, file format, palette, display sizes, accessibility treatment and intended placement. Both alternatives must meet those requirements. Comparing a finished manual icon with an unreviewed generated preview understates the second workflow's work.
Use the alternative you would actually choose. An existing icon library may be a better comparison than a custom commission for a common search or settings symbol.
This worksheet models a labor-only baseline, such as manual drawing, with any shared cash costs omitted from both workflows. Its alternative includes labor plus additional cash spending. If your baseline has separate license or contract fees, compare those costs in a fuller budget; do not silently treat a labor-only result as the total cost of that baseline.
Keep a record for each attempted asset:
| Record | Why it matters |
|---|---|
| Accepted or rejected | Only accepted deliverables belong in the unit-cost denominator |
| Briefing and setup time | Preparing a reusable style or integration takes work |
| Generation and retry charges | Include unsuccessful attempts that consumed credits |
| Selection and review time | A completed job is not a quality decision |
| Manual finishing time | Exact colors, spacing and simplified paths can need further work |
| Export and integration costs | Use the access conditions and destination you actually need |
The inspectable SVG examples show why these distinctions matter: a generated palette can need correction even when the shape is useful.
Separate labor value from additional cash spending
Use one consistent hourly value for the labor comparison. If you use loaded labor cost, say so in your own record. If you are valuing a founder's freed time, that is a planning assumption rather than a cash receipt.
Savings become cash savings only when spending actually falls, such as reduced contracted work. If payroll remains the same, hours saved may create capacity without reducing the bank balance. Do not count that capacity once as labor savings and again as speculative extra revenue.
Use actual tool charges for the same period. Check current SVG AI plans and the cost shown before a generation or edit; SVG downloads require eligible paid access. This worksheet does not assume a particular model, credit grant or subscription.
For a subscription shared across projects, choose and document an allocation method. Do not charge the whole subscription to each project, and do not value unused credits as accepted designs. For a cash-budget decision, also check the full payment required even if only part of it is allocated to this project.
Work through one hypothetical batch
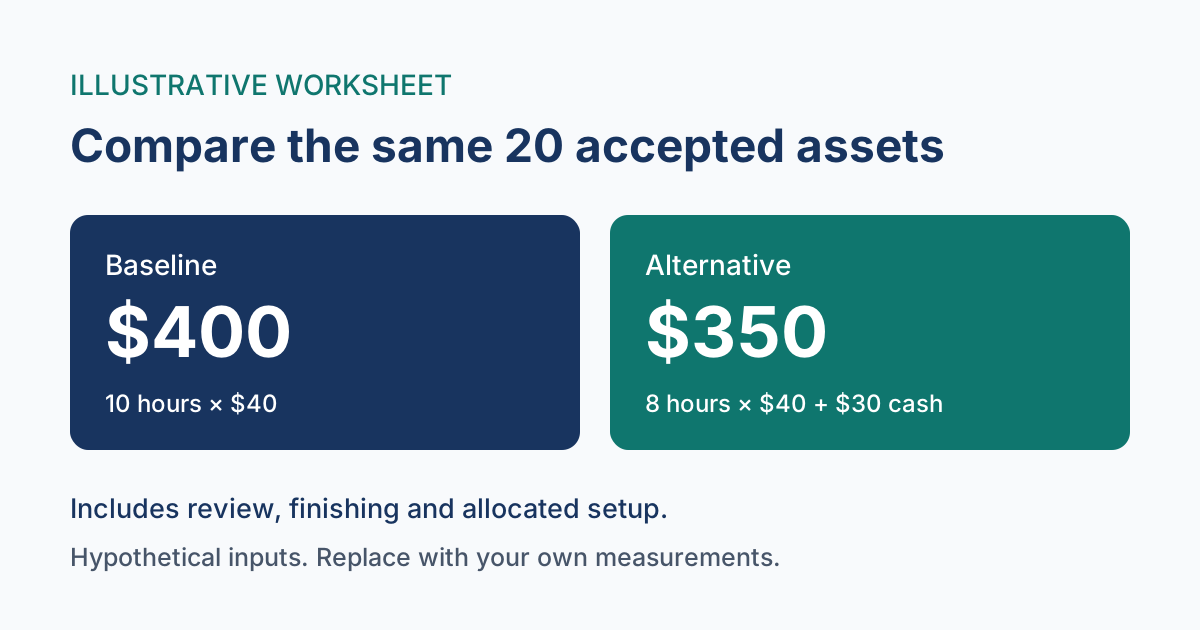
Suppose both workflows deliver 20 accepted assets. Assume ten hours for the baseline, seven ongoing hours for the alternative, one additional hour of setup, a labor value of $40 per hour and $30 of additional cash spending. The seven hours already include failed attempts, selection, review and manual finishing.
| Item | Calculation | Modeled cost |
|---|---|---|
| Baseline labor | 10 hours × $40 | $400 |
| Alternative ongoing labor | 7 hours × $40 | $280 |
| Allocated one-time setup | 1 hour × $40 | $40 |
| Additional cash cost | Hypothetical input | $30 |
| Alternative total | $280 + $40 + $30 | $350 |
| Net modeled benefit | $400 − $350 | $50 |
The cost reduction is $50 / $400 × 100 = 12.5%. The baseline costs $400 / 20 = $20 per accepted asset; the alternative costs $350 / 20 = $17.50. Two hours remain freed after accounting for setup: 10 − 7 − 1 = 2.
These are consequences of the selected inputs, not observations about a typical designer or a tested SVG AI workflow. If the alternative requires ten ongoing hours instead of seven, its cost becomes $470 and the net benefit becomes negative $70.
Give an ROI percentage an explicit denominator
The worksheet also calculates return on additional investment, using extra cash spending plus the allocated setup labor:
baseline cost = baseline hours × hourly value
alternative cost = (ongoing hours + setup hours) × hourly value + extra cash
net modeled benefit = baseline cost − alternative cost
additional investment = setup hours × hourly value + extra cash
return on additional investment = net modeled benefit / additional investment × 100
For the hypothetical batch, additional investment is $40 + $30 = $70, so the return is $50 / $70 × 100 ≈ 71.43%. That differs from the 12.5% cost reduction because the denominators answer different questions. Neither percentage means revenue increased or cash profit was realized.
If additional investment is zero, that ROI percentage is undefined. The worksheet still shows costs and net benefit. If the baseline cost is zero, a percentage cost reduction is also undefined. Do not replace either with an infinite-return claim.
Count credits from attempts, not final filenames
When estimating a generation budget, multiply the credits for each action by the number of those actions. Include additional variations and AI edits where they consume credits. Use the current displayed charge for the selected settings.
A simple hypothetical example illustrates capacity arithmetic: if each attempted output costs two credits, 250 attempts require 500 credits. A balance of 350 plus a 50-credit purchase totals 400 and is 100 credits short. That calculation does not establish any current plan size or price, or mean all 250 attempts will become accepted assets.
For a mixed workflow, add the action groups separately. Manual source edits may avoid another generation charge, but the person's time still belongs in the comparison.
Test the assumption most likely to change the result
Change the alternative work hours in the worksheet. This is useful when review and finishing are uncertain. Change the hourly value and cash cost separately so you can see which assumption explains the result.
Avoid projecting a first small batch to hundreds of assets without checking whether the subjects, complexity, rejection rate and review process remain comparable. Track the next batch and revise the estimate using its actual results.
The practical decision is whether the new workflow meets the same requirements at an acceptable total cost. A negative result is useful information: an existing library, direct code edit or established design process may fit that task better. A positive result supports that measured project, not a universal break-even promise.