A website using SVG, a developer trying AI, and an SVG file loading quickly are three different observations. One percentage cannot answer all three questions. Before using an SVG statistic in a product decision, identify exactly what was counted and when.
This page now keeps a smaller set of directly attributable observations. Earlier role-specific adoption tables, market projections and broad performance claims have been removed because we cannot supply sources that substantiate those exact figures. Do not use those earlier tables as survey results from SVG AI.
A dated source register
| Question | Source and observation | What it does not measure |
|---|---|---|
| How common is SVG on websites? | The W3Techs SVG page retrieved September 14, 2026 reports 67.7% of websites | The share of individual images, generated files or paying design-tool customers |
| What status does the published SVG 2 report have? | The W3C page identifies the October 4, 2018 publication as a Candidate Recommendation | A guarantee that every feature works in every browser or design application |
| How much can one SVG shrink? | Our downloadable Fieldnote example changes from a prepared 2,652-byte input to a 1,901-byte optimized output | A market-wide average, page-load improvement or universal quality guarantee |
The sources below explain these observations individually. Keep their units separate when citing them.
Website adoption is not image share
W3Techs' SVG usage page reports the percentage of websites using the format and says its reports update daily. The retrieved page shows 67.7%. Use its methodology and current dated report when you need a fresh figure.
That observation does not say that 67.7% of all images are SVG. A website can use several image formats. Nor does it identify which files were generated with AI or establish demand for a particular SVG product. A change over time needs comparable reports and dates, not a comparison between differently defined statistics.
Specification status and implementation are separate
The published SVG 2 technical report labels itself a Candidate Recommendation dated October 4, 2018. It also links an editor's draft and the working group's repository. The publication date alone is not evidence that no subsequent work exists.
For implementation, check the features your actual file uses. A path-based logo, a filter-heavy illustration and a file with embedded images are different test cases. The SVG file-format guide walks through the structure of a real output rather than treating a filename extension as a complete compatibility test.
File measurements need the original and the method
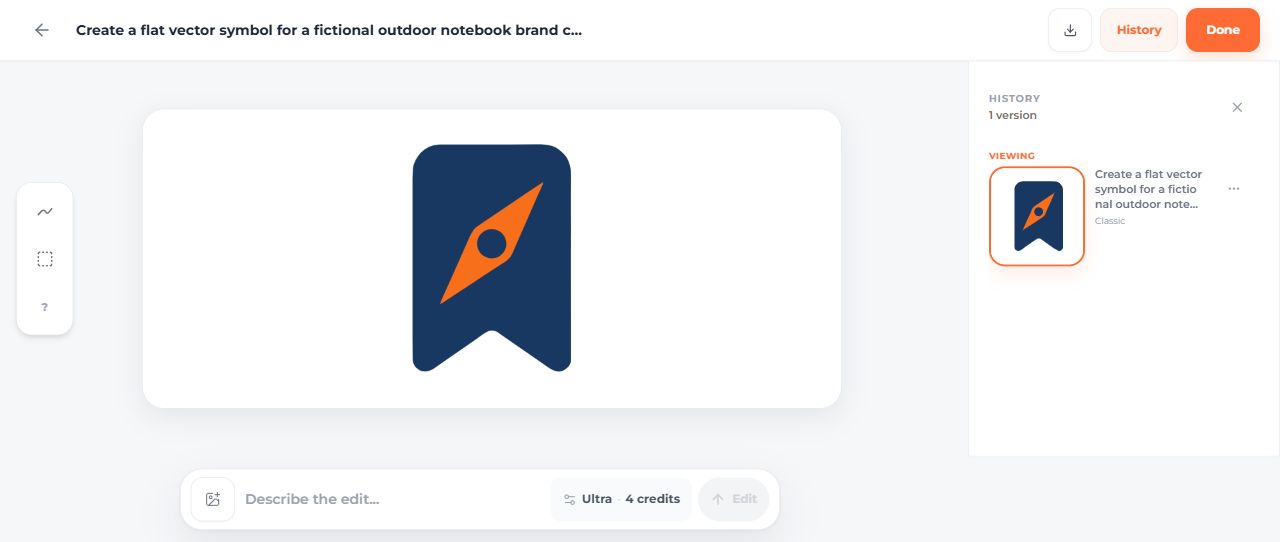
Fieldnote is a fictional notebook mark created in the AI SVG generator dashboard on September 14, 2026. The run used Classic, one SVG and a transparent background, with two credits displayed.
The untouched file is 2,552 bytes. After manually setting exact brand fills, proportional fitting and an accessible title, the prepared input is 2,652 bytes. SVGO 4.0.0 reduces that input to 1,901 bytes with the documented settings. Those three numbers describe different stages; they should not be mixed into a single unnamed percentage.
The complete optimization tutorial includes both files, the configuration and raster comparisons. The broader three-file precision experiment tests four settings and reports changes as well as savings. Neither experiment measures website revenue, user recognition or Core Web Vitals.
A practical check before citing an SVG figure
Record the exact source page, date, unit, denominator and collection method. Distinguish a vendor's own product measurements from an independent survey. For a benchmark, look for downloadable inputs, software versions, settings and outputs. For an adoption statistic, read how the sample is defined.
Broad developer surveys can provide useful context, but a percentage about general AI-tool use is not a percentage about AI-generated SVGs. A technology report also cannot establish a specific tool's output quality without testing that tool's output.
If the measurement needed for your decision is missing, run a small test that answers that decision and label its limits. An inspectable local example can be useful without representing the whole industry.
Sources and reproducible examples
- W3Techs SVG usage statistics: website-format adoption; retrieved September 14, 2026.
- W3C SVG 2 technical report: specification and publication status.
- Fieldnote file measurements: exact local asset measurements and renderer comparisons.
- Three-file precision results: four optimizer settings with the full numerical results.
When citing a source's figure, link to that source and retain its date and definition. When citing the SVG AI experiments, describe their small, selected file sets and the actual checks performed.